

Intelligence Resource (IR)
Praktisk Intelligence (I)/Business Intelligence (BI)/
OmverdensOvervåking (OO)

Kunnskapskilden
Intelligence/Business Intelligence/ OmverdensOvervåkingE-BusinessInternet Marketing IntelligenceInternett MarketingWeb utviklingsprossenCD/Video utviklingsprossenTips& TriksLinker |
Kunnskapskilden – E-Business

Kunnskapskilden – E-Business –
E-Business, E-Customer, Relationship and Interactivity
Dissertation
The E-Business, the E-Customer,
their Relationship and Interactivity
Jan Vig
Dissertation av Jan Vig om E.Business, E-Customer, Relationship and Interactivity (286 sider) i forbindelse med Masterstudie i Information Technology and Communication Juni 2000.
The E-Retailer Business, the E-Customer,
their Relationship and Interactivity
Table of Contents
Chapter 5 |
A Successful Case Study Amazon,com |
Chapter Five A Successful Case study – Amazon.com5.1 Introduction |
5.2 |
Amazon’s position |
Among the E-Retailers Amazon.com’s position has been steady at the front, but not concerning profit. One of the reason for that is that one of the strategies from the companies management have to get big fast and get a huge loyal customer base and get into new areas of interest to their customers. This strategy is consistent with an industry looking to consolidate to maximize the value of their customers. The strategy is also consistent with stickiness. Amazon.com’s goal is to entice users to visit their sites and never to leave, let alone wanting too. These aspects are the defining components of stickiness.
Amazon.com has therefore invested heavily both in backend and front end to reach this goal.
Its effort to build itself a top-class distribution system is racking up huge losses too. A lot of investors begin to be anxious when or if Amazon.com will be profitable. At the start of Amazon.com early investors were told not to expect dividends for at least five years time. Most of the Investors have faith in Bezos, and the problem is not laying in the fact to get Amazon profitable, but that such an expansion to reach the goal of the biggest store online cost tremendous amount of money in early investment to reap the award later on. And it is known that most investors are not too patient.
As seen below a framework for Amazon.com. The figure summaries the system that originally made Amazon.com unique.
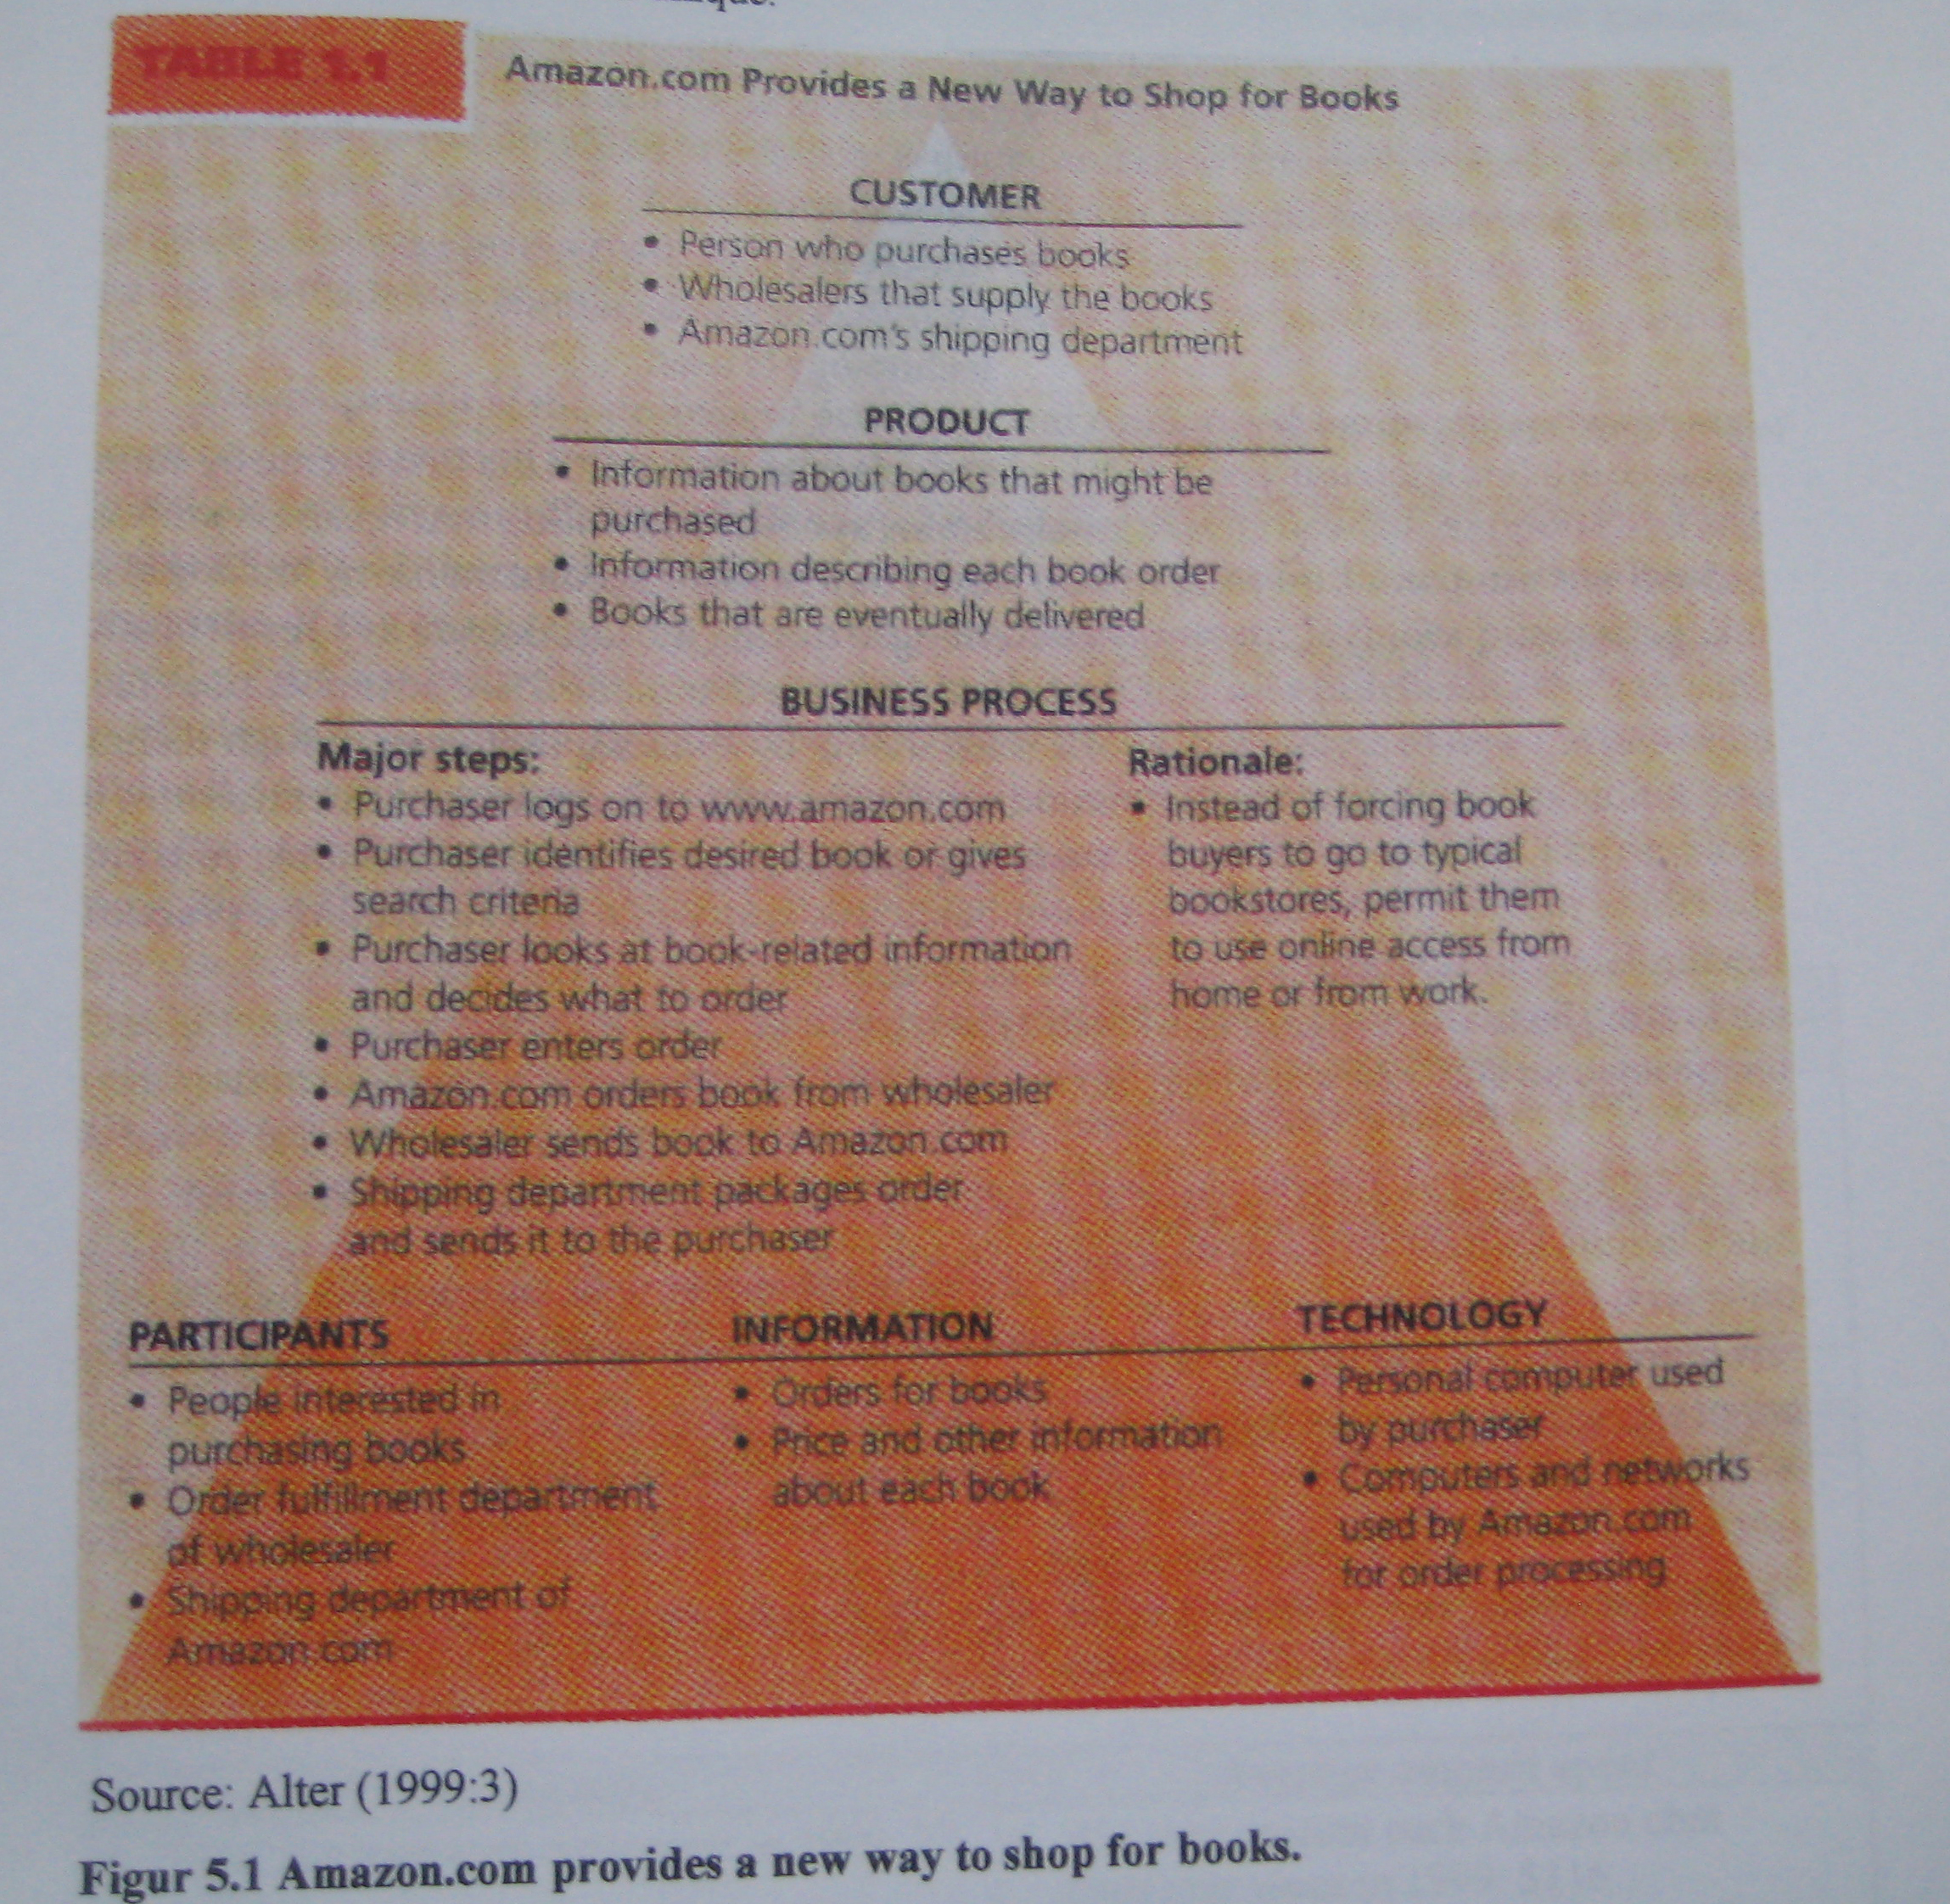
Source: Alter (1999:3)
Figur 5.1 Amazon.com provides a new way to shop for books.
Some headlines about Amazon.com are: (Gardner, April 26,2000)
Financial results from the first quarter of this year show that while Amazon nearly doubled its revenue, it sustained bigger losses than during the same period last year.
Amazon.com reported a loss of USD122 million for Q1, a substantial increase on a loss of USD36 million in Q1 of last year. The company reported a first-quarter operating loss of 35 cents a share significantly lower than the 55 cents per share loss of Q4 in 1999.
The same period last year saw 12 cents per share losses. Sales rose 95% from last year’s calendar first quarter to $574 million from USD294 million in 1999. Total customer accounts were up over 20 million. The most important metric orders from repeat customers represented 76% of all orders in the period. In tandem with the announcement of Q1 earnings, Amazon announced that it gained 3.1 million new customers in the first three months of this year and now boasts a customer base of 20 million.
The customer growth from last quarter was up 3.1 million accounts to 20 million. And 76% of total sales came from repeat purchasers. Amazon.com. continues to solidify itself as a well-capitalized long-term player in electronic commerce. At this point, it is in a class by itself, considering its market share and brand presence compared to so many of the world’s other «dot-coms.»
Below some important facts about Amazon.com.com:
|
||||||||||||||||
Source: http://www.topica.com/lists/iconoclash
Table 5.1 Figures about Amazon.com
In the Top 20 E-Tailer’s report during April 2000 the following result was presented:
|
||||||||||||||||||||||||||||||||||||||||||||||||||||||||||||||||||||||||||||||||||||||||||||||||||||||||||||||||||||||||||||||||||||||||||||||||||||||||||||||||||||||||||||||||||||||
Table 5.2 Top 20 Web Retailers Among US Home Users April 2000
In another online survey of 1,200 US Internet users by Ernst & Young, both men and women selected Amazon.com and Barnesandnoble.com, and CDNow as their favorite sites.
|
|||||||||||||||||||||||||||||||||||||||||||||||||||||||||||
Table 5.3 Top E-Commerce Sites by Gender
According to results of Ernst & Young’s survey, which polled 1,283 users, found that while stores such as Amazon.com, Ebay and CDnow are the most popular and most frequently used sites, they are not necessarily the most commercially successful. For that reason, the real online retail winners of the holiday season are not apparent in traffic patterns. For example, while 42.1 percent of shoppers purchased at Amazon.com and spent an average of USD128 each, 3.7 percent of those polled went to Best Buy and spent an average of USD233 each. 2.9 percent of respondents went to Walmart and spent an average of USD167 each while over one fifth of users went to eToys to spend an average of USD127 each. Reasons for shopping by Amazon.com were ease of use, good selection, good prices and good availability of products.
The success of these is due largely in part to the type of product Amazon.com sell and the compatibility of those products with the Net as a distribution medium.
Buying a book online is a relatively stress-free shopping experience. The Customers read the review, look at the cover and if they like what they see, they buy with relatively low risk attached. Clothes, financial services and other things are a different story. The clothes have to fit, the service has to be right and the motivation to buy other things online has to be compelling.
Download Dissertation
Hvis du har noen spørsmål eller ønsker å vite mer om Intelligence Resource kan du bruke kontaktmulighetene nedenfor:
VIG CONSULTING
ORG.NR: 977 505 992
Jan Vig
Daglig leder
__________________
Kirkeveien 35, NO-1710, SARPSBORG
Mobile : +47 414 43 727
e-mail: ja-vig@online.no
Web: www.slowdown.no ,www.intelligence.no , www.risikoledelse.com
Copyright © 2000-2015 VIG CONSULTING

Legg igjen en kommentar